Carbon Monitoring in a Precast Plant Is a Production Problem, Not a Reporting One
Most talk about carbon in construction starts and ends with a spreadsheet. You fill in the numbers, submit them, and move on. That is carbon accounting. It is not carbon management, and the gap between the two costs precast manufacturers more than they think.
Carbon monitoring in a precast plant works best when you treat it as a way to see your production process clearly, not as a separate compliance task. After over twenty years inside precast manufacturing, I can tell you the two are the same job done well.
Carbon waste and operational waste are the same thing
Look at what actually drives your plant’s carbon footprint:
Every one of these is a cost driver and a production problem before it is ever a carbon figure. You do not need a carbon specialist to fix them. You need a clearer view of what your own plant is doing.
A practical digital twin of your operation gives you that view.
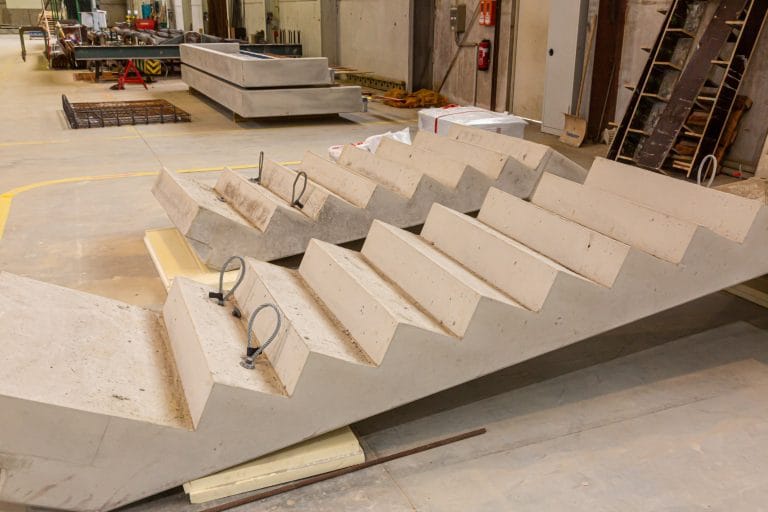
What a digital twin actually means for a precast plant
Set aside the 3D animations and the marketing language. For a precast facility, a useful digital twin is a structured model of your process. It connects material inputs, energy use, cycle times, and output volumes, then calculates the carbon associated with each.
Think of it as joining your batching system, your energy meters, your curing records, your rejection logs, and your transport data into one picture of what is happening on the floor and what it costs you. The output is numbers a plant manager can act on, not a report formatted for a board pack.
You do not have to start with full automation
This is the part most people miss. You can start with a spreadsheet.
Manual logging of cement delivered, electricity readings, diesel refills, and scrap counts gives you a usable baseline within weeks. It will not be exact, but it shows roughly where your carbon sits per cubic metre and points you at the biggest problem areas.
The next step is digitising the human input layer. Tablets on the shop floor, QR codes on moulds, digital batch reports, digital rejection logs. Now you get carbon figures per element type instead of plant-wide averages. Carbon per hollowcore slab. Carbon per wall panel. Carbon per beam. That level of detail is where it earns its keep, because you can see which moulds run consistently high, which shifts waste curing energy, and which mixes cost more than they should.
Full automation comes later, if you want it. Smart meters, batching software integration, steam metering, and RFID on reinforcement cages get you to real-time figures. When one line is running heavier on carbon per cubic metre than another, you know that day, not at the end of the month.
Where the carbon actually lives
In a typical precast plant, cement is the largest single source of embodied carbon in an element by a wide margin. Accelerated curing is usually the next biggest energy draw. Rejects and rework sit underneath both, because anything that does not leave the yard on the first attempt carries its carbon cost twice.
A digital twin makes this visible. Once your team can see what a rejected element costs to replace, in carbon and in money, the conversation about preventing rejects changes on its own.
So does the mix design conversation. You can model what happens if you reduce cement content and compensate with fly ash or slag, while accounting for the changes this brings to curing requirements. The model shows you which route gives the lower carbon outcome and the lower cost, rather than leaving you to guess.
The lean connection
Worth saying plainly: every waste category in lean manufacturing maps to a carbon cost.
If you have ever run a value stream mapping exercise at your plant, try overlaying carbon figures on each process box. What you get is a carbon stream map. It shows you where the waste sits in operational and environmental terms simultaneously, using the same data.
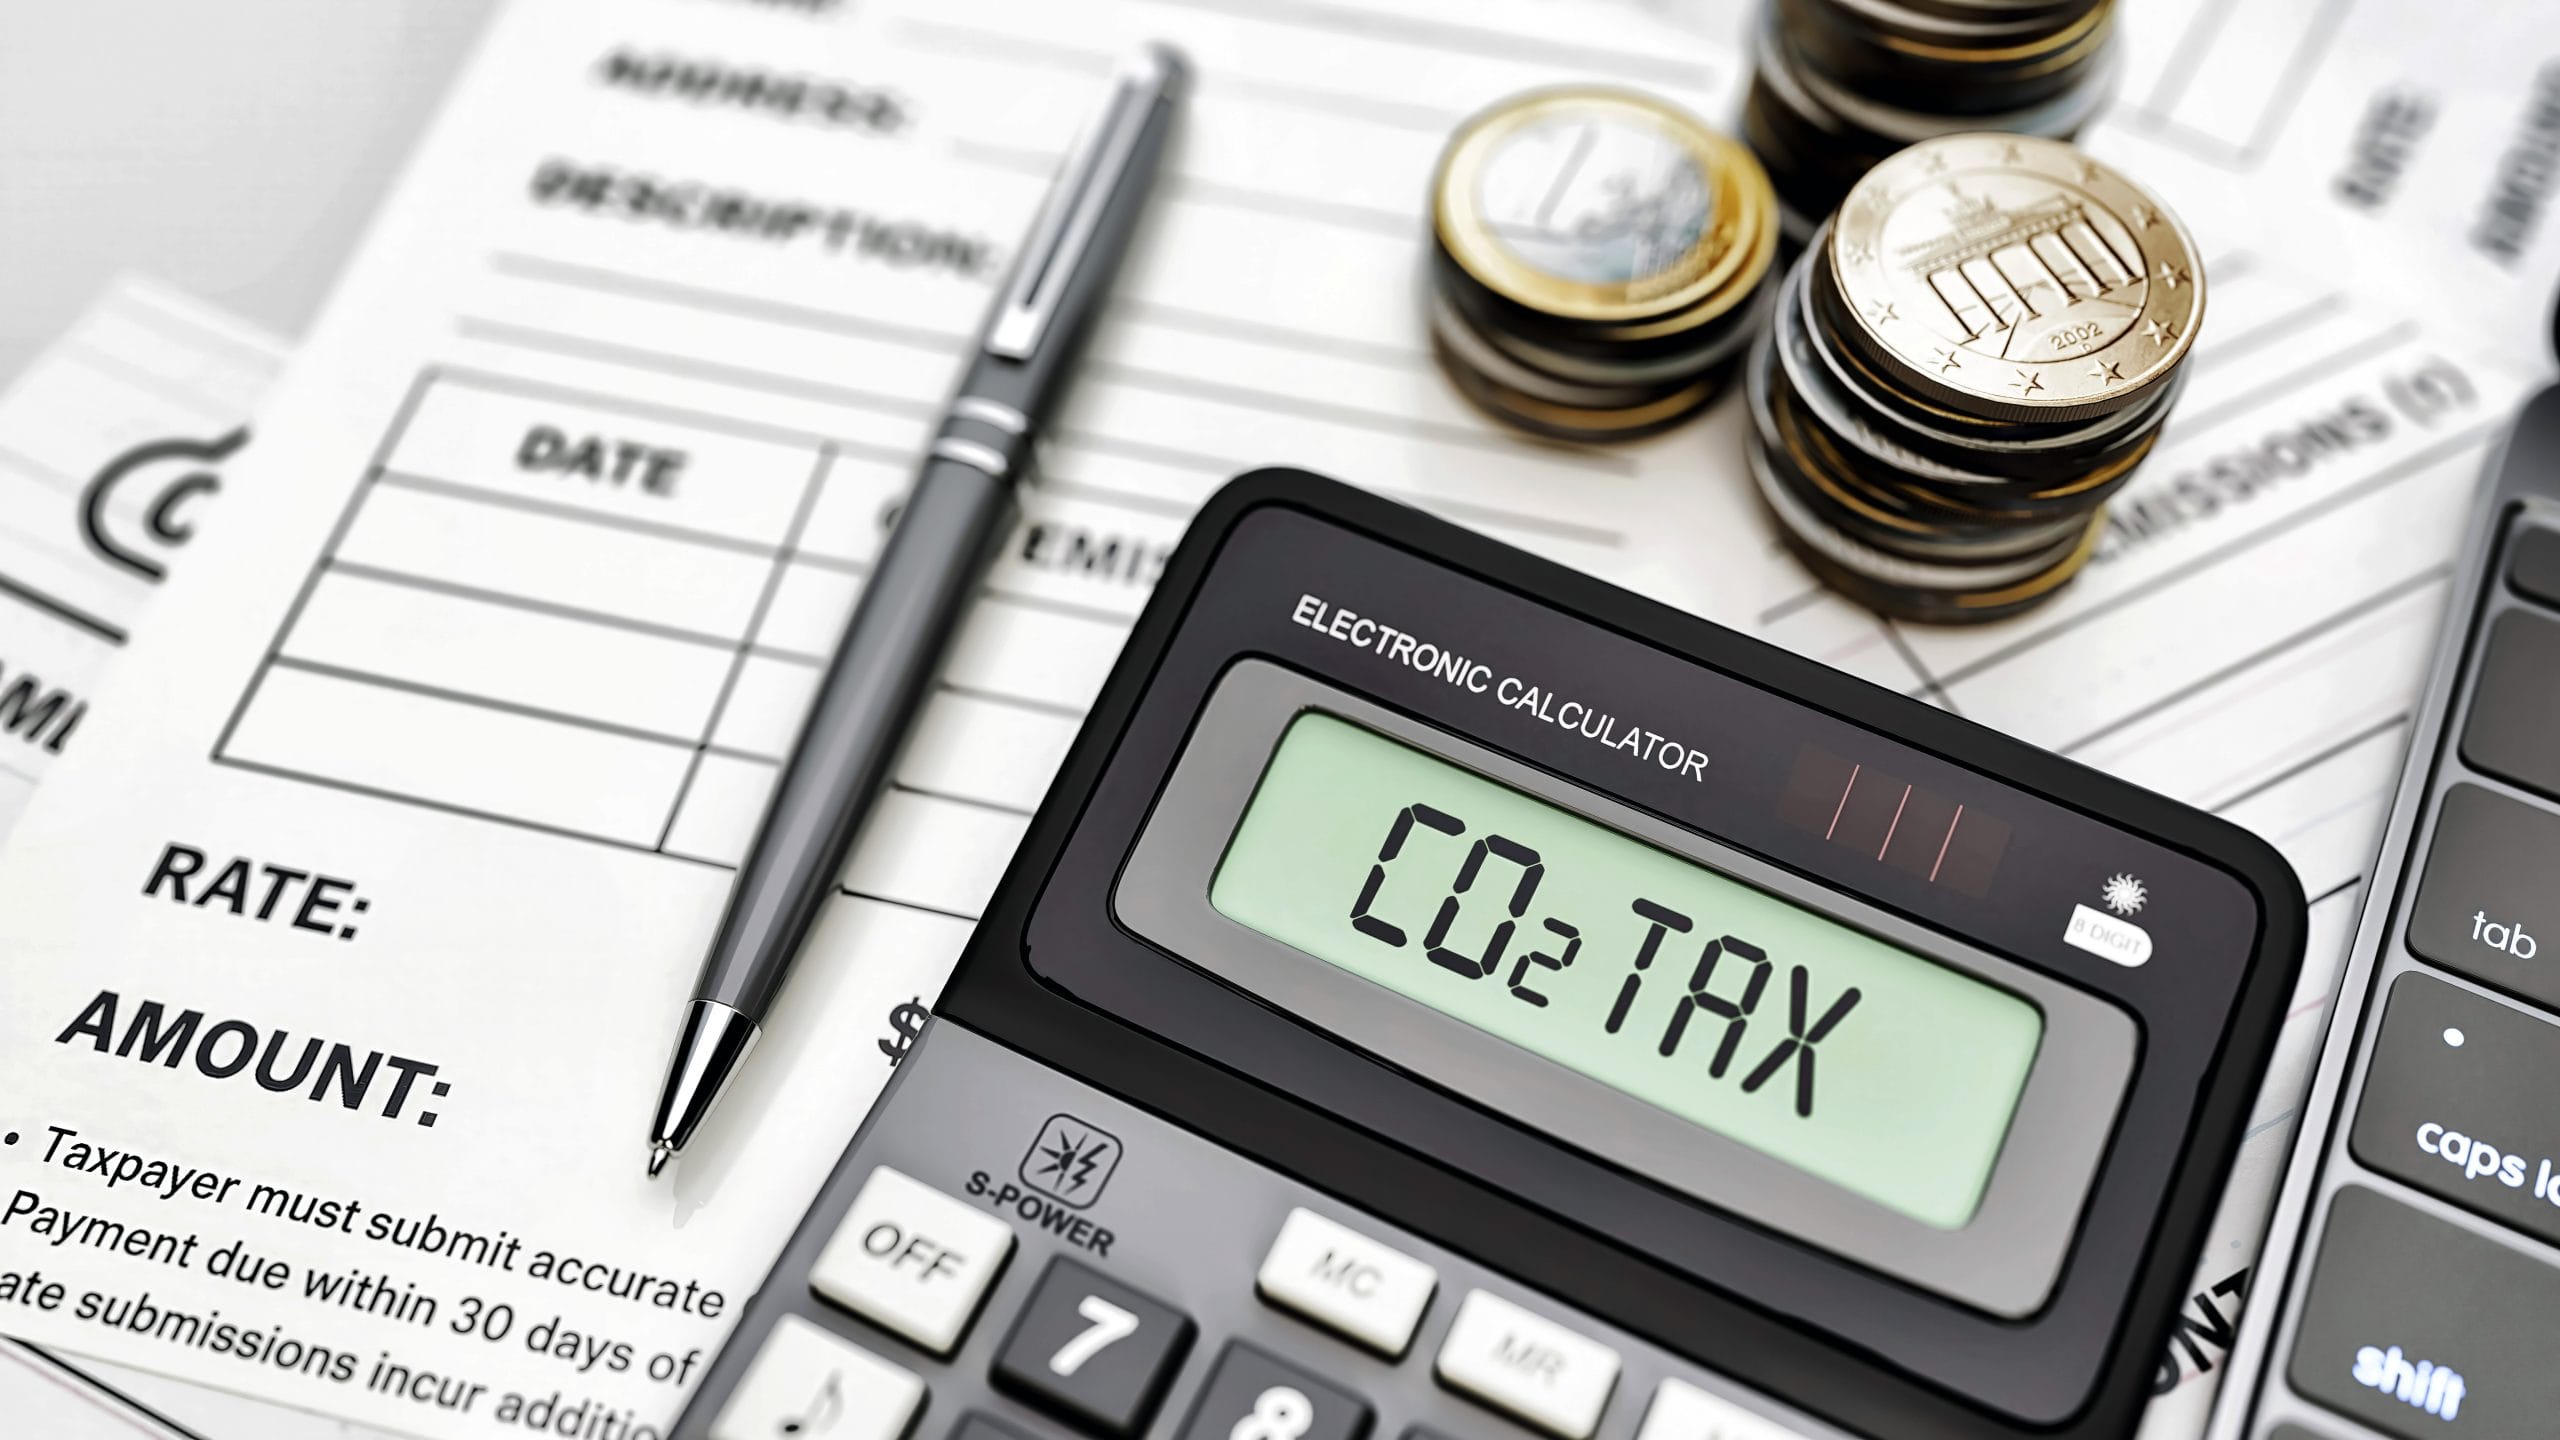
The business case is coming, whether you are ready or not
Carbon taxes are expanding across Europe. Clients in public procurement and private development are increasingly asking for verified carbon data for each element. Environmental Product Declarations backed by real production data and aligned with EN 15804 are starting to appear in tenders as a requirement rather than a bonus.
Plants that have built even a basic carbon-monitoring habit will be in a far stronger position when that becomes standard. Those who have not will be working it out under pressure.
Where to start
Starting does not require a large capital outlay or a long implementation programme. It requires an honest look at where your carbon actually comes from and a structured way to make it visible. Begin with the spreadsheet baseline. Move to per-element figures once you trust the data. Automate only the parts where real-time numbers change a decision you would otherwise make blind.
At Lean Precast Solutions, that is the work I do with precast and offsite manufacturers. If you want to know what carbon monitoring could reveal about your plant, get in touch or leave a comment below.